A1c to Average Glucose Converter
| Boundary Profile | Glycemic Level | Glucose Standard Dev. | Inter-day Stability | Estimated Risk Quotient | Progress Target |
|---|
| HbA1c Reference | eAG Equivalent | IFCC Metric | Fasting Normal Correlative | Est. Median Value | Classification |
|---|
A1c to Average Glucose Converter: Convert HbA1c to eAG Instantly:
When managing long-term metabolic health, laboratory blood test results can feel overwhelming. Doctors track systemic blood sugar history using Glycated Hemoglobin (HbA1c). However, home testing kits and continuous glucose monitors display numbers in milligrams per deciliter (mg/dL) or millimoles per liter (mmol/L). Using an A1c to average glucose converter bridges this gap, allowing you to convert HbA1c to eAG and match lab results directly with daily fingerstick logs.
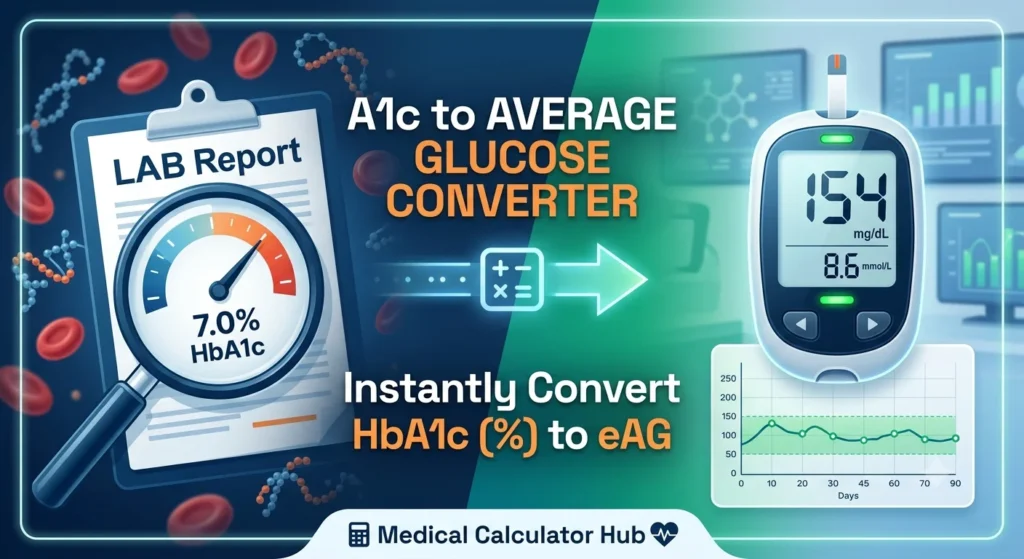
To convert HbA1c to Estimated Average Glucose (eAG) immediately, use the official American Diabetes Association (ADA) linear equation: eAG (mg/dL) = (28.7 * HbA1c) – 46.3.
An A1c to average glucose converter translates your 90-day lab percentage into daily mg/dL or mmol/L metrics, giving you complete clarity over your metabolic trends.
Table of Contents
Why Use an A1c to Average Glucose Converter?
Many ask why laboratory results are written as a percentage while home testing kits display direct concentration values. An A1c to average glucose converter translates that percentage into an Estimated Average Glucose (eAG) level.
Converting HbA1c to eAG gives a clear look at your 90-day blood sugar average, ensuring you track long-term health trends rather than isolated daily spikes. Glucose molecules bind (glycate) to hemoglobin in red blood cells, which live for roughly 120 days. Measuring glycated hemoglobin provides an accurate snapshot of average blood sugar over a 2-to-3-month timeframe. Because everyday diabetes decisions—like adjusting insulin doses or planning meals—are made in real-time mg/dL or mmol/L units, an A1c to glucose conversion chart serves as an essential link between lab reports and daily tracking.
Interactive A1c to Glucose Calculator & Conversion Tool
Using an eAG / A1c conversion tool allows you to quickly bridge the gap between 3-month laboratory averages and daily glucose monitoring:
- Converting HbA1c to eAG: Input your percentage (e.g., 7.0%) to find your average blood glucose over the past 8 to 12 weeks.
- Converting Average Glucose to A1c: Input your 90-day continuous glucose monitor (CGM) mean or logbook average (e.g., 155 mg/dL) to estimate your next laboratory HbA1c reading.
Automated calculations eliminate manual math errors and deliver instant results formatted for US standard measurements (mg/dL) and global standards (mmol/L and mmol/mol).
How to Calculate A1c from Daily Blood Sugar Logs
If you wear a Continuous Glucose Monitor (CGM) or keep a manual logbook, you can reverse this calculation. Knowing how to calculate A1c from daily blood sugar readings lets you estimate upcoming lab results before visiting the doctor.
Gathering at least 14 to 30 days of consistent blood sugar logs gives you a reliable dataset. Continuous Glucose Monitors automatically track average glucose (often labeled as Glucose Management Indicator or GMI). Plugging this aggregate number into the reverse ADA formula provides an accurate baseline prediction of your upcoming laboratory blood work.
Mathematical Foundations & Official ADA Translation Formulas
The relationship between glycated hemoglobin (HbA1c) and estimated average glucose (eAG) is modeled using linear regression based on clinical data from the landmark A1c-Derived Average Glucose (ADAG) study.
1. The Standard Linear Equation: Converting A1c to eAG (mg/dL)
In algebra, a linear equation takes the standard form y = mx + c, where m represents the slope and c represents the y-intercept. For glycemic conversion:
- Slope (m) = 28.7 (For every 1% increase in HbA1c, average glucose increases by 28.7 mg/dL)
- Y-Intercept (c) = -46.3
Plain-text formula for copying:
eAG (mg/dL) = (28.7 * HbA1c) – 46.3
Worked Example:
For an HbA1c of 7.0%:
eAG = (28.7 * 7.0) – 46.3
eAG = 200.9 – 46.3 = 154.6 mg/dL (rounded to 155 mg/dL).
2. Inverse Linear Function: Calculating A1c from Daily Average Blood Sugar
To solve for HbA1c when average glucose is known, rearrange the original linear equation:
Plain-text formula for copying:
Estimated HbA1c (%) = (Average Glucose + 46.3) / 28.7
Worked Example:
For a 90-day average blood sugar of 126 mg/dL:
Estimated HbA1c = (126 + 46.3) / 28.7
Estimated HbA1c = 172.3 / 28.7 = 6.0%.
3. Dimensional Analysis & Unit Conversion (mg/dL to mmol/L)
Converting between American mass concentration units (mg/dL) and international molar concentration units (mmol/L) relies on dimensional analysis based on the molecular mass of glucose (180.156 g/mol). Dividing mass density by the conversion factor of 18.0155 converts mg/dL into mmol/L.
Plain-text formulas for copying:
eAG (mmol/L) = eAG (mg/dL) / 18.0155
IFCC Global Unit (mmol/mol) = (HbA1c – 2.15) * 10.929
Worked Example:
For an eAG of 154.6 mg/dL:
eAG (mmol/L) = 154.6 / 18.0155 = 8.58 mmol/L (rounded to 8.6 mmol/L).
Estimated Average Glucose Chart Reference Matrix
Refer to this comprehensive estimated average glucose chart to visualize clinical conversions side-by-side:
| HbA1c Reference | eAG Equivalent (mg/dL) | eAG Equivalent (mmol/L) | IFCC Global Metric | Clinical Status Tier |
| 4.5% | 83 mg/dL | 4.6 mmol/L | 26 mmol/mol | Optimal / Healthy Baseline |
| 5.0% | 97 mg/dL | 5.4 mmol/L | 31 mmol/mol | Optimal / Healthy Baseline |
| 5.5% | 112 mg/dL | 6.2 mmol/L | 37 mmol/mol | Optimal / Healthy Baseline |
| 5.7% | 117 mg/dL | 6.5 mmol/L | 39 mmol/mol | Prediabetes Entry Threshold |
| 6.0% | 126 mg/dL | 7.0 mmol/L | 42 mmol/mol | Prediabetes Action Range |
| 6.5% | 140 mg/dL | 7.8 mmol/L | 48 mmol/mol | Type 2 Diabetes Diagnosis Limit |
| 7.0% | 155 mg/dL | 8.6 mmol/L | 53 mmol/mol | Controlled Glycemic Target |
| 7.5% | 169 mg/dL | 9.4 mmol/L | 58 mmol/mol | Moderately Elevated |
| 8.0% | 183 mg/dL | 10.2 mmol/L | 64 mmol/mol | Elevated Uncontrolled Baseline |
| 9.0% | 212 mg/dL | 11.8 mmol/L | 75 mmol/mol | High Glycation Action Limit |
| 10.0% | 241 mg/dL | 13.4 mmol/L | 86 mmol/mol | Severe Hyperglycemic State |
| 12.0% | 298 mg/dL | 16.5 mmol/L | 108 mmol/mol | Critical Medical Action Phase |
Cross-referencing your readings with this estimated average glucose chart helps ensure you stay aligned with your health targets.
Understanding Glycemic Variance in Your A1c Conversion
A vital concept to track when converting HbA1c to eAG is glycemic variance. Two individuals can enter 7.0% into the converter and receive the same eAG output of 155 mg/dL, yet experience completely different daily blood sugar patterns:
- Patient A (Low Variance): Blood sugar stays within a narrow band, moving steadily between 130 mg/dL and 175 mg/dL.
- Patient B (High Variance): Blood sugar swings sharply, dropping to 60 mg/dL and spiking up to 250 mg/dL.
Understanding glycemic variability helps minimize severe low sugar episodes (hypoglycemia) and post-meal spikes (hyperglycemia), even if overall HbA1c looks well-controlled.
HbA1c vs. eAG: Key Differences Explained
Although HbA1c and Estimated Average Glucose (eAG) assess the same health trend, they serve distinct roles:
- HbA1c (Glycated Hemoglobin): A percentage metric used globally by physicians to diagnose prediabetes, Type 1 diabetes, and Type 2 diabetes.
- eAG (Estimated Average Glucose): A concentration unit (mg/dL or mmol/L) matching daily fingerstick meters and Continuous Glucose Monitors (CGMs).
Converting HbA1c to eAG helps patients evaluate whether daily blood sugar logs align with formal laboratory findings.
Pro-Tips for Managing an Accurate HbA1c Conversion to mg/dL
- Sync Your Units Correctly: Switch between mg/dL (US standard) and mmol/L (international) based on your lab documents.
- Account for Red Blood Cell Lifespan: Anemia, pregnancy, blood loss, or kidney conditions alter red blood cell turnover, causing minor variations between calculated eAG and actual lab A1c.
- Track Waking vs. 24-Hour Averages: Fasting blood sugar checks only reflect overnight levels and often run lower than a true 24-hour eAG average.
Frequently Asked Questions (FAQs):
What is a normal Estimated Average Glucose (eAG) level for my A1c?
A normal eAG is below 117 mg/dL (6.5 mmol/L), matching an HbA1c under 5.7%. Prediabetes ranges from 117 mg/dL to 140 mg/dL (A1c 5.7% to 6.4%), while eAG over 140 mg/dL (A1c 6.5%+) indicates diabetes.
How do I convert HbA1c to average glucose manually?
Apply the ADAG formula: eAG (mg/dL) = (28.7 * HbA1c) – 46.3. For 7.0% A1c: (28.7 * 7) – 46.3 = 154.6 mg/dL. Divide by 18.0155 for mmol/L (8.6 mmol/L).
How do I convert 64 mmol/mol to mg/dL?
64 mmol/mol equals an 8.0% HbA1c, which converts to an eAG of 183 mg/dL (10.2 mmol/L).
What average glucose level matches an HbA1c of 7.0%?
An HbA1c of 7.0% matches an eAG of 155 mg/dL (8.6 mmol/L).
Why is my daily average glucose lower than my calculated laboratory A1c?
Home fingersticks miss post-meal spikes and overnight trends, whereas lab eAG measures a full 24-hour cycle over 3 months.
Can I accurately calculate my HbA1c percentage from my daily average blood sugar?
Yes, use the formula: Estimated HbA1c (%) = (Average Glucose + 46.3) / 28.7. A 126 mg/dL average yields an estimated 6.0% A1c.